Mapping Halts along Transit Routes
The journey of a surface transit vehicle is characterized by frequent stop-and-go operations, not only for picking up and dropping off passengers at transit stops but also at intersections, depending on the traffic management approach. During its trip, regardless of traffic conditions, an urban transit vehicle will call at most or all transit stops along its planned route and cross numerous intersections, which may be controlled by traffic lights, yield signs, or stop signs. Differences in street patterns and traffic management philosophies, as well as traffic conditions, determine whether a transit vehicle can proceed through them at cruising speed or must slow or stop, thereby affecting its running time. We refer to these points along a route where a vehicle might be required to stop as ‘halts’, and we mapped their geographic distribution and density across the 20 busiest routes in each city in our 32-city sample.
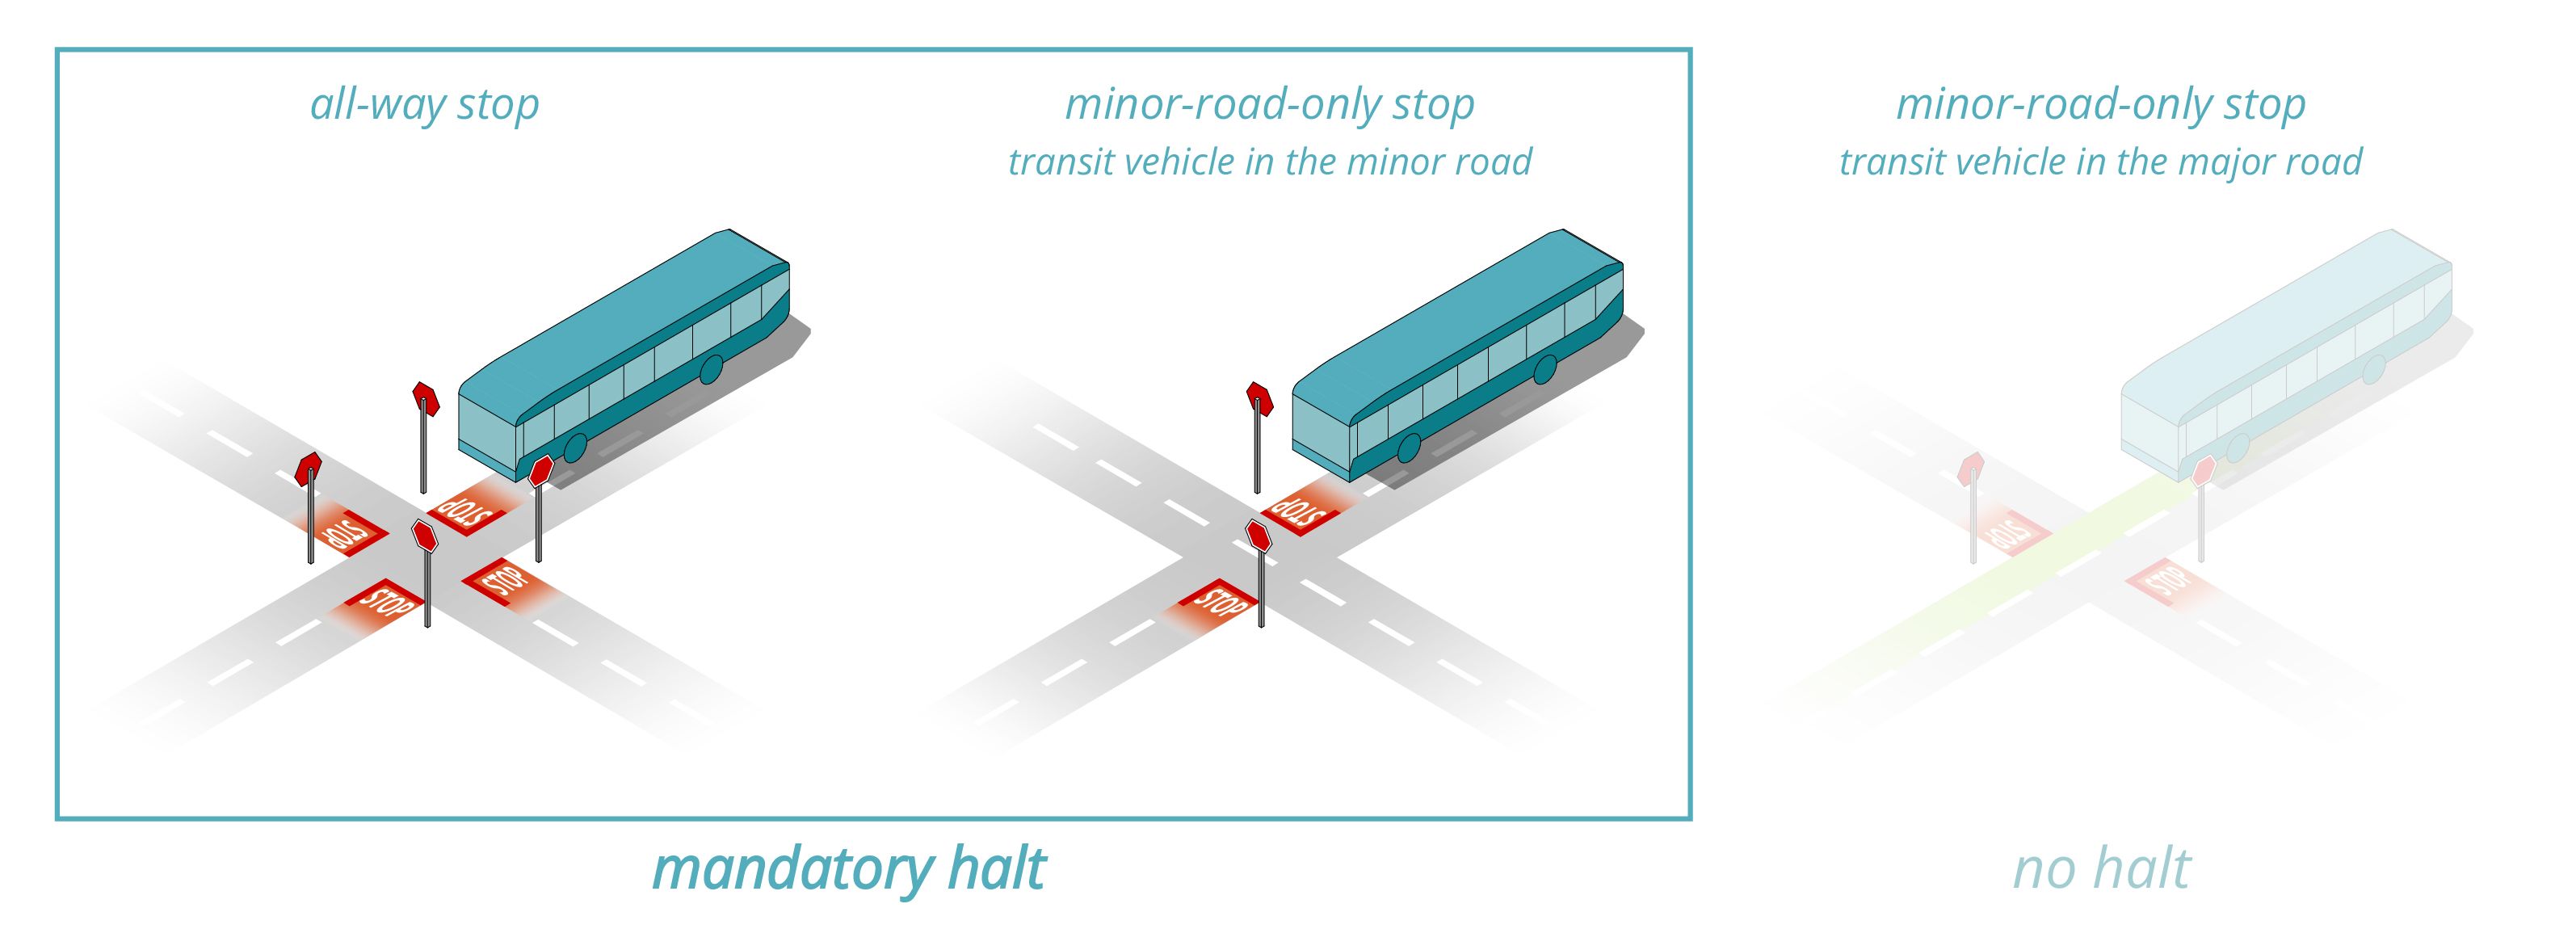
Stop-controlled intersections
Stop-controlled intersections require vehicles to come to a complete halt before proceeding through the intersection. They can be divided into all-way stops, which require vehicles from all legs to halt before proceeding through the intersection in first-in, first-out order, and minor-road-only stop control, in which vehicles on the main artery are given full priority over those entering from minor legs. The delay caused by halting at a stop-controlled intersection can add at least 7-8 seconds per intersection to travel time, or more, depending on the number of queuing vehicles and pedestrian volumes [1,2].
Signal-controlled intersections
Signal-controlled intersections manage conflicts between vehicles entering the intersection by temporally separating sets of movements into phases that repeat over cycles. The delay at a signal-controlled intersection for a transit vehicle depends on the duration of the red phase, the queue length to be cleared in front of the transit vehicle (including delays from left- and right-turning vehicles where no dedicated lane is provided), and the flows of pedestrians and cyclists for unprotected right and left turns. Transit Signal Priority (TSP)—a term denoting a broad range of passive and active strategies that modify the standard signal cycle—can reduce, or even eliminate, delays experienced by transit vehicles at signal-controlled intersections under certain conditions [3,4].

Transit stops
Transit stops are the primary source of non-intersection-related halts. The time required for a transit vehicle to decelerate, pull over to the curb, open the doors, wait for passengers to board and alight, close the doors, and finally re-enter the traffic flow, sometimes referred to as “stop penalty,” can vary widely depending on multiple factors. The length of dwell times depends on the volumes of boarding and alighting passengers, boarding practices, the physical characteristics of stops and vehicles (e.g., reciprocal floor heights or whether the stop is on-lane or pull-over), and the location of the stops, before or after the intersection [5,6,7]. Several strategies can be deployed to reduce delays at transit stops.

How often is a transit vehicle likely to stop?
The urban environment traversed by a transit vehicle is the primary determinant of how often it halts. Dense gridded cities with frequent intersections and intense pedestrian flows, such as Manhattan, offer a very different landscape from suburban arterials engineered for the car era, with highly hierarchized street layouts and widely spaced intersections, as in suburban Toronto.
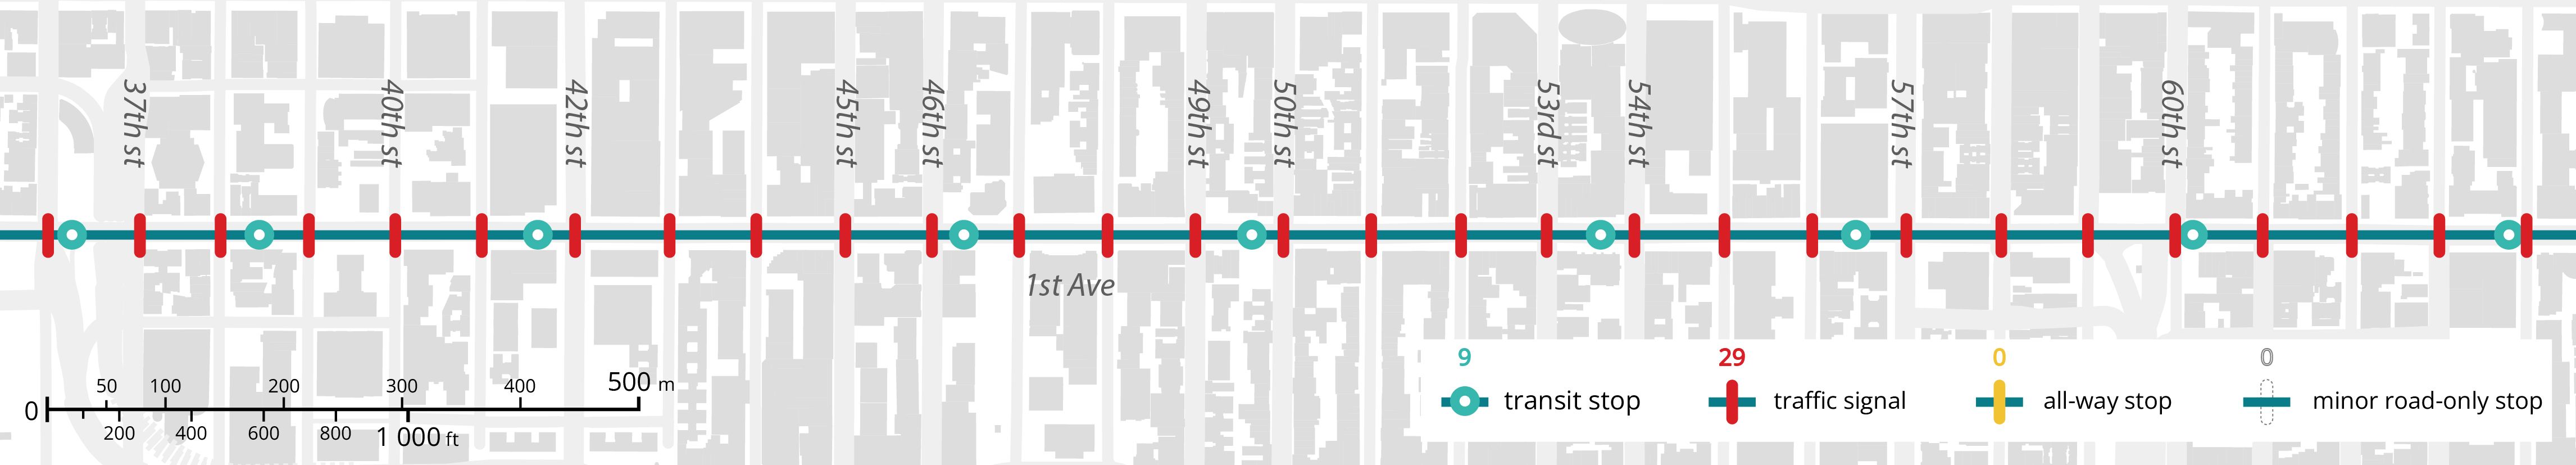
New York City - M15 Southbound
The intersections of the Manhattan 1811 Commissioners’ Plan grid are almost entirely controlled by traffic signals. North-South bus routes, like the M15 northbound on 1st Avenue, encounter a signalized intersection every 200 feet (approximately 60 m). Since the late 1940s, signals on one-way avenues have been coordinated to ensure a green wave for vehicles, but not for frequently stopping buses.
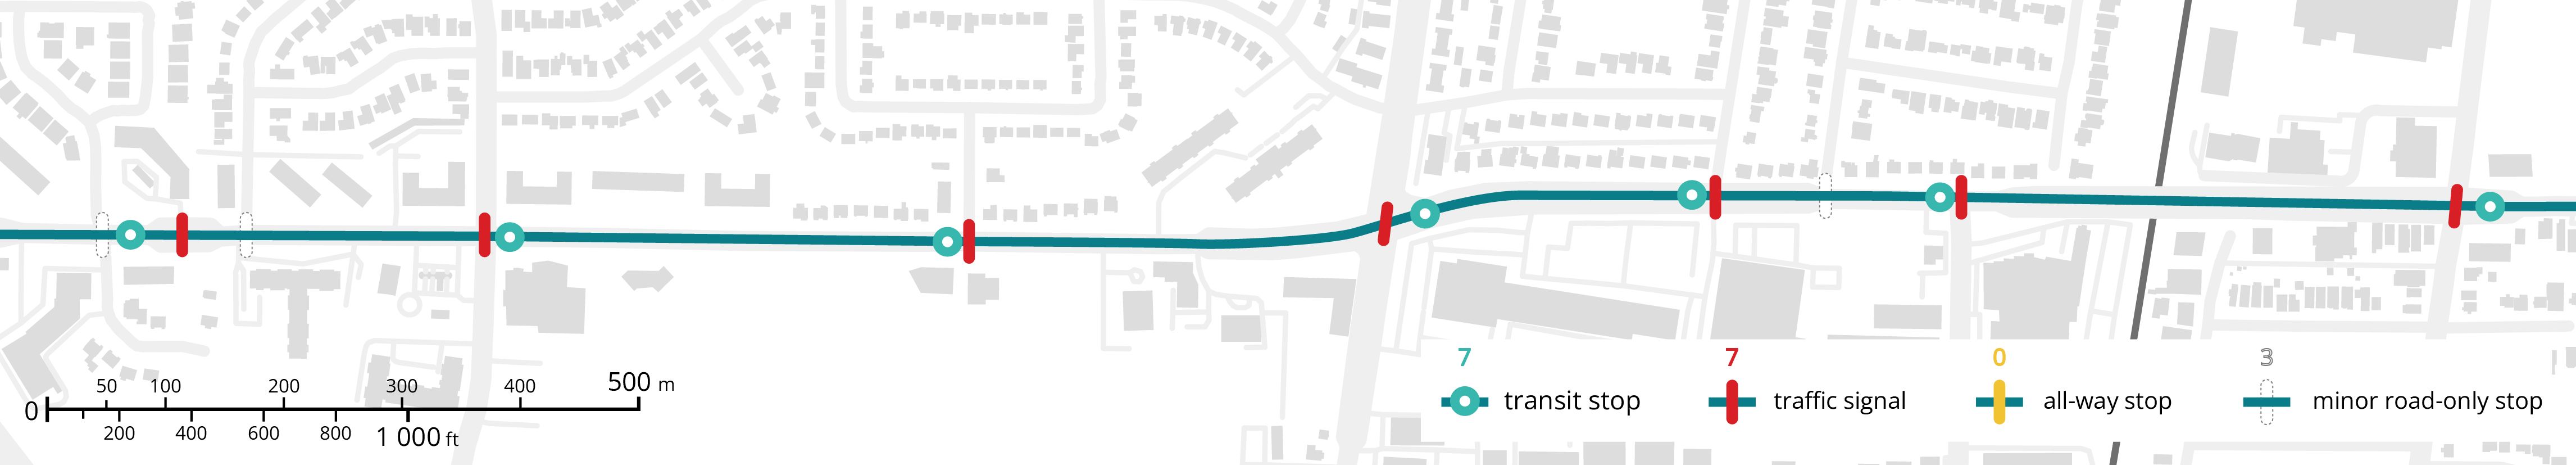
Toronto - 52 Lawrence West
In the widely spaced grid of arterials of postwar suburban Toronto, the 52 Lawrence bus encounters few halts along its trip. Intersections with other arterials, collector roads, and major commercial parking lots are widely spaced and are managed by signalized intersections. Minor road-only stops are used in a few locations, while opposite-direction diffused access to abutting properties is managed via a center-left turn lane, a common practice in postwar suburban arterials across North America.
However, the street pattern is not the only determinant of how many potential halts a bus is likely to encounter. Traffic management approaches significantly affect the likelihood that a transit vehicle will stop at an intersection. All-way stops are uncommon outside North America, where priority is usually given to a specific flow, using minor-street-only stops or yields to manage lateral streets. Even in dense pre-car urban contexts with closely spaced intersections, some jurisdictions have limited the number of potential halts for transit vehicles by defining a stronger hierarchy of flows between transit thoroughfares and lateral streets, which is reflected in the prevalence of minor-street-only stops over traffic lights and all-way stops, a traffic management strategy often implemented as part of broader circulation plans defining priority traffic flows.
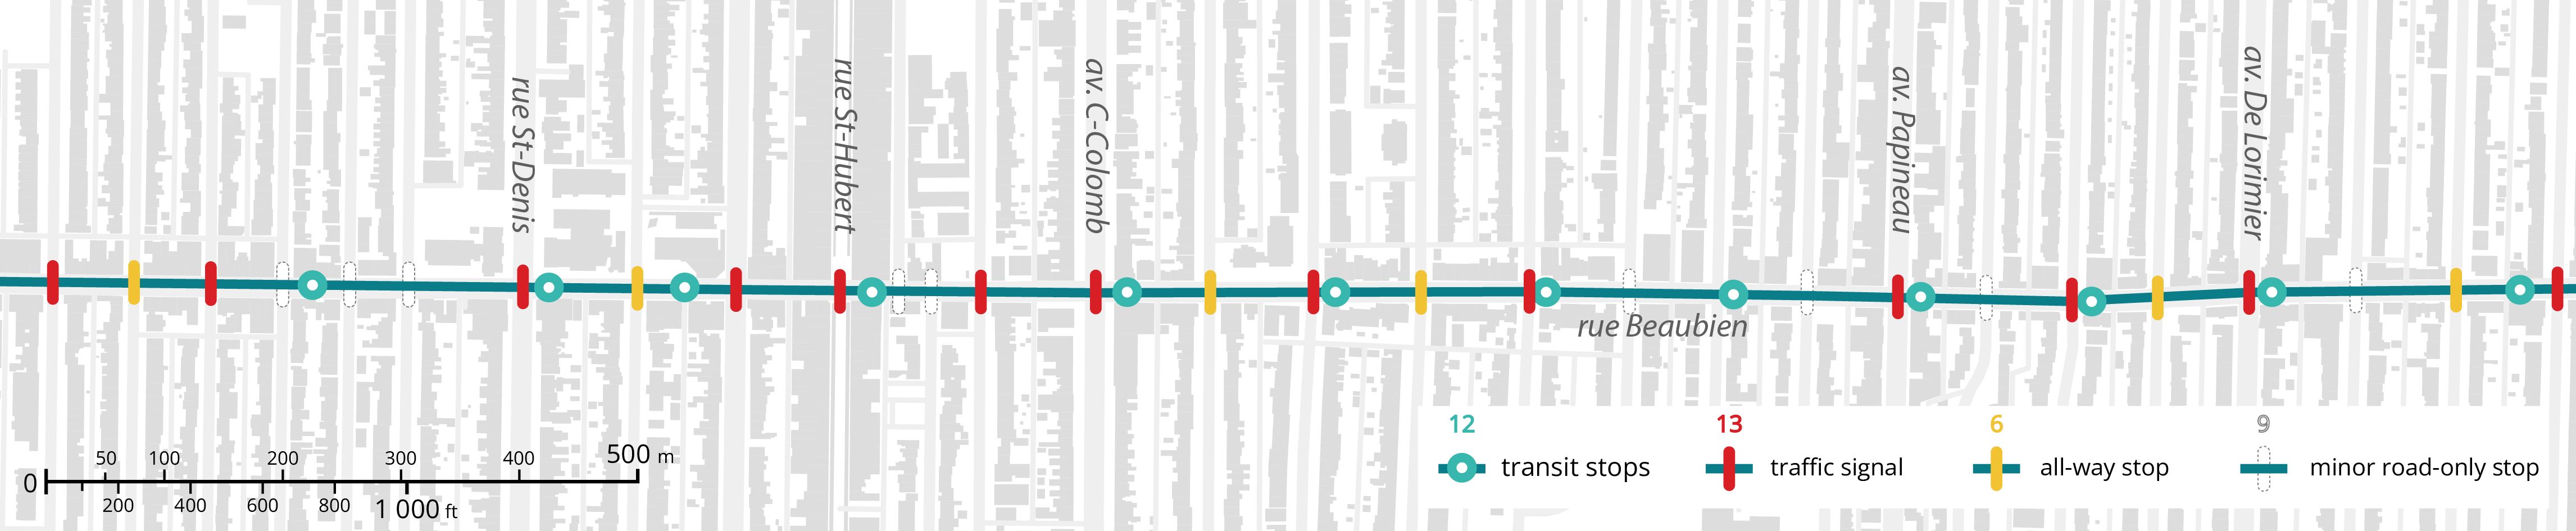
Montréal - 18 Beaubien
The streetcar suburbs of Montréal are characterized by long North-South rectangular blocks inherited from the Nouvelle France’s elongated agricultural subdivisions. As a result, East-West bus routes encounter an intersection every 80-90 meters (260-295 feet) as, for example, the frequent bus line 18 on rue Beaubien. Most intersections along Beaubien are controlled by traffic lights or all-way stops, which were introduced in 2019 to improve pedestrian safety at crossings previously managed with minor road-only stops. Traffic signals are also frequently used at crossings with minor streets. As a result, the buses on line 18 are likely to come to a halt as often as every 70-80 meters (250 feet).
Zurich - tram line 3
The 19th- and early 20th-century parts of Zürich, like most cities in continental Europe, are characterized by mid-rise apartment blocks that define an irregularly gridded street pattern with frequent intersections. However, most intersections crossed by tram lines 2 and 3 along Badenerstrasse are managed via a minor-road-only stop sign. Pedestrian safety is ensured with zebra pedestrian crossings and refuge islands rather than all-way stops. A clear flow hierarchy, embedded in neighborhood-level circulation patterns and road design, converts potentially complex intersections into unsignalized ones by limiting the number of car maneuvers within the tramway right-of-way and preventing through movements across local streets, which are often limited to right-in/right-out movements. In short, Zurich applies a traffic management strategy that systematically prioritizes flows along major transit corridors.
This six-legged intersection at Lochergut in Zurich exemplifies how proactive traffic management, implemented through area-wide circulation plans, can reduce the number of signalized intersections that a transit vehicle encounters, even in denser areas. In the early 2010s, it was converted from a five-leg major signalized intersection to a minor-road-only stop-controlled intersection, with no through vehicular traffic permitted across the transit right-of-way, as part of a broader plan to reconfigure traffic flows in the Western part of the city known as FLAMA West Zürich [8].
How many halts is a bus route likely to encounter in…
Mapping likely halts.
This map shows the points along the 20 transit routes with the most weekday trips in a subset of cities where buses or trams are likely to halt. Data are derived from GTFS and OpenStreetMap.
Halts: Select a city

The density of likely halts.
This diagram shows the linear distribution of points along the 20 transit routes with the most weekday trips where the transit vehicle will likely come to a halt.
Halts Scatter: Select a city

How does the density of halts correlate with average speed?
A higher density of halts does not necessarily result in a slower trip. Some of the delays caused by these likely halts can overlap, for example, when a transit stop is located before or after a controlled intersection. Coordinated traffic signals and Transit Signal Priority can reduce delays at signalized intersections. Traffic levels, passenger volumes, and boarding practices, all factors independent of halt density, also affect speeds. However, the graph below shows an inverse correlation between the density of halts and the average weekday scheduled speed of a transit route, broadly across cities and individually within each city. The chart also highlights that the transit routes with the highest halt density (>10 per km) are all located in North American cities with large, gridded pre-car cores. It is well known that transit stops are generally located closer together in North America than elsewhere, especially compared with the widely spaced stops in Central and Eastern Europe [9]. This higher density of halts in legacy North American cities is also a consequence of the widespread use of traffic signals and all-way stops to control intersections, resulting from a non-hierarchical traffic-management paradigm, compared to the prevalence of lateral-street-only stops in European cities, such as Zürich, Vienna, München, Berlin or Bologna, where most routes have fewer than 8 halts per km.
Bibliography
- Lyon, N. B. (1988). A study of four-way stop intersections: the validation of a delay model (No. AFITCICIA89010).
- Kyte, M., Zegeer, J., & Lall, B. K. (1991). Empirical models for estimating capacity and delay at stop-controlled intersections in the United States. In Intersections without Traffic Signals II: Proceedings of an International Workshop, 18–19 July, 1991 in Bochum, Germany (pp. 335-361). Berlin, Heidelberg: Springer Berlin Heidelberg.
- CERTU (2001). La priorité aux feux pour les véhicules de transport en commun. Éditions CEREMA.
- Smith, H. R., Hemily B., Ivanovic M. (2005). Transit Signal Priority (TSP): A Planning and Implementation Handbook. ITS America.
- Diab, E. I., & El-Geneidy, A. M. (2015). The farside story: measuring the benefits of bus stop location on transit performance. Transportation Research Record, 2538(1), 1-10.
- Glick, T. B., & Figliozzi, M. A. (2017). Measuring the determinants of bus dwell time: New insights and potential biases. Transportation Research Record, 2647(1), 109-117.
- Rashidi, S., Ataeian, S., & Ranjitkar, P. (2023). Estimating bus dwell time: A review of the literature. Transport Reviews, 43(1), 32-61.
- Weidmann, R. (2008). Im sog der Autobahn. FlaMa West Zürich. Tec21, 40/2008.
- Devunuri, S., Lehe, L. J., Qiam, S., Pandey, A., & Monzer, D. (2024). Bus stop spacing statistics: Theory and evidence. Journal of Public Transportation, 26, 100083.